Dashboard UX
Turning overwhelming complexity into clarity for data-driven SEO professionals.
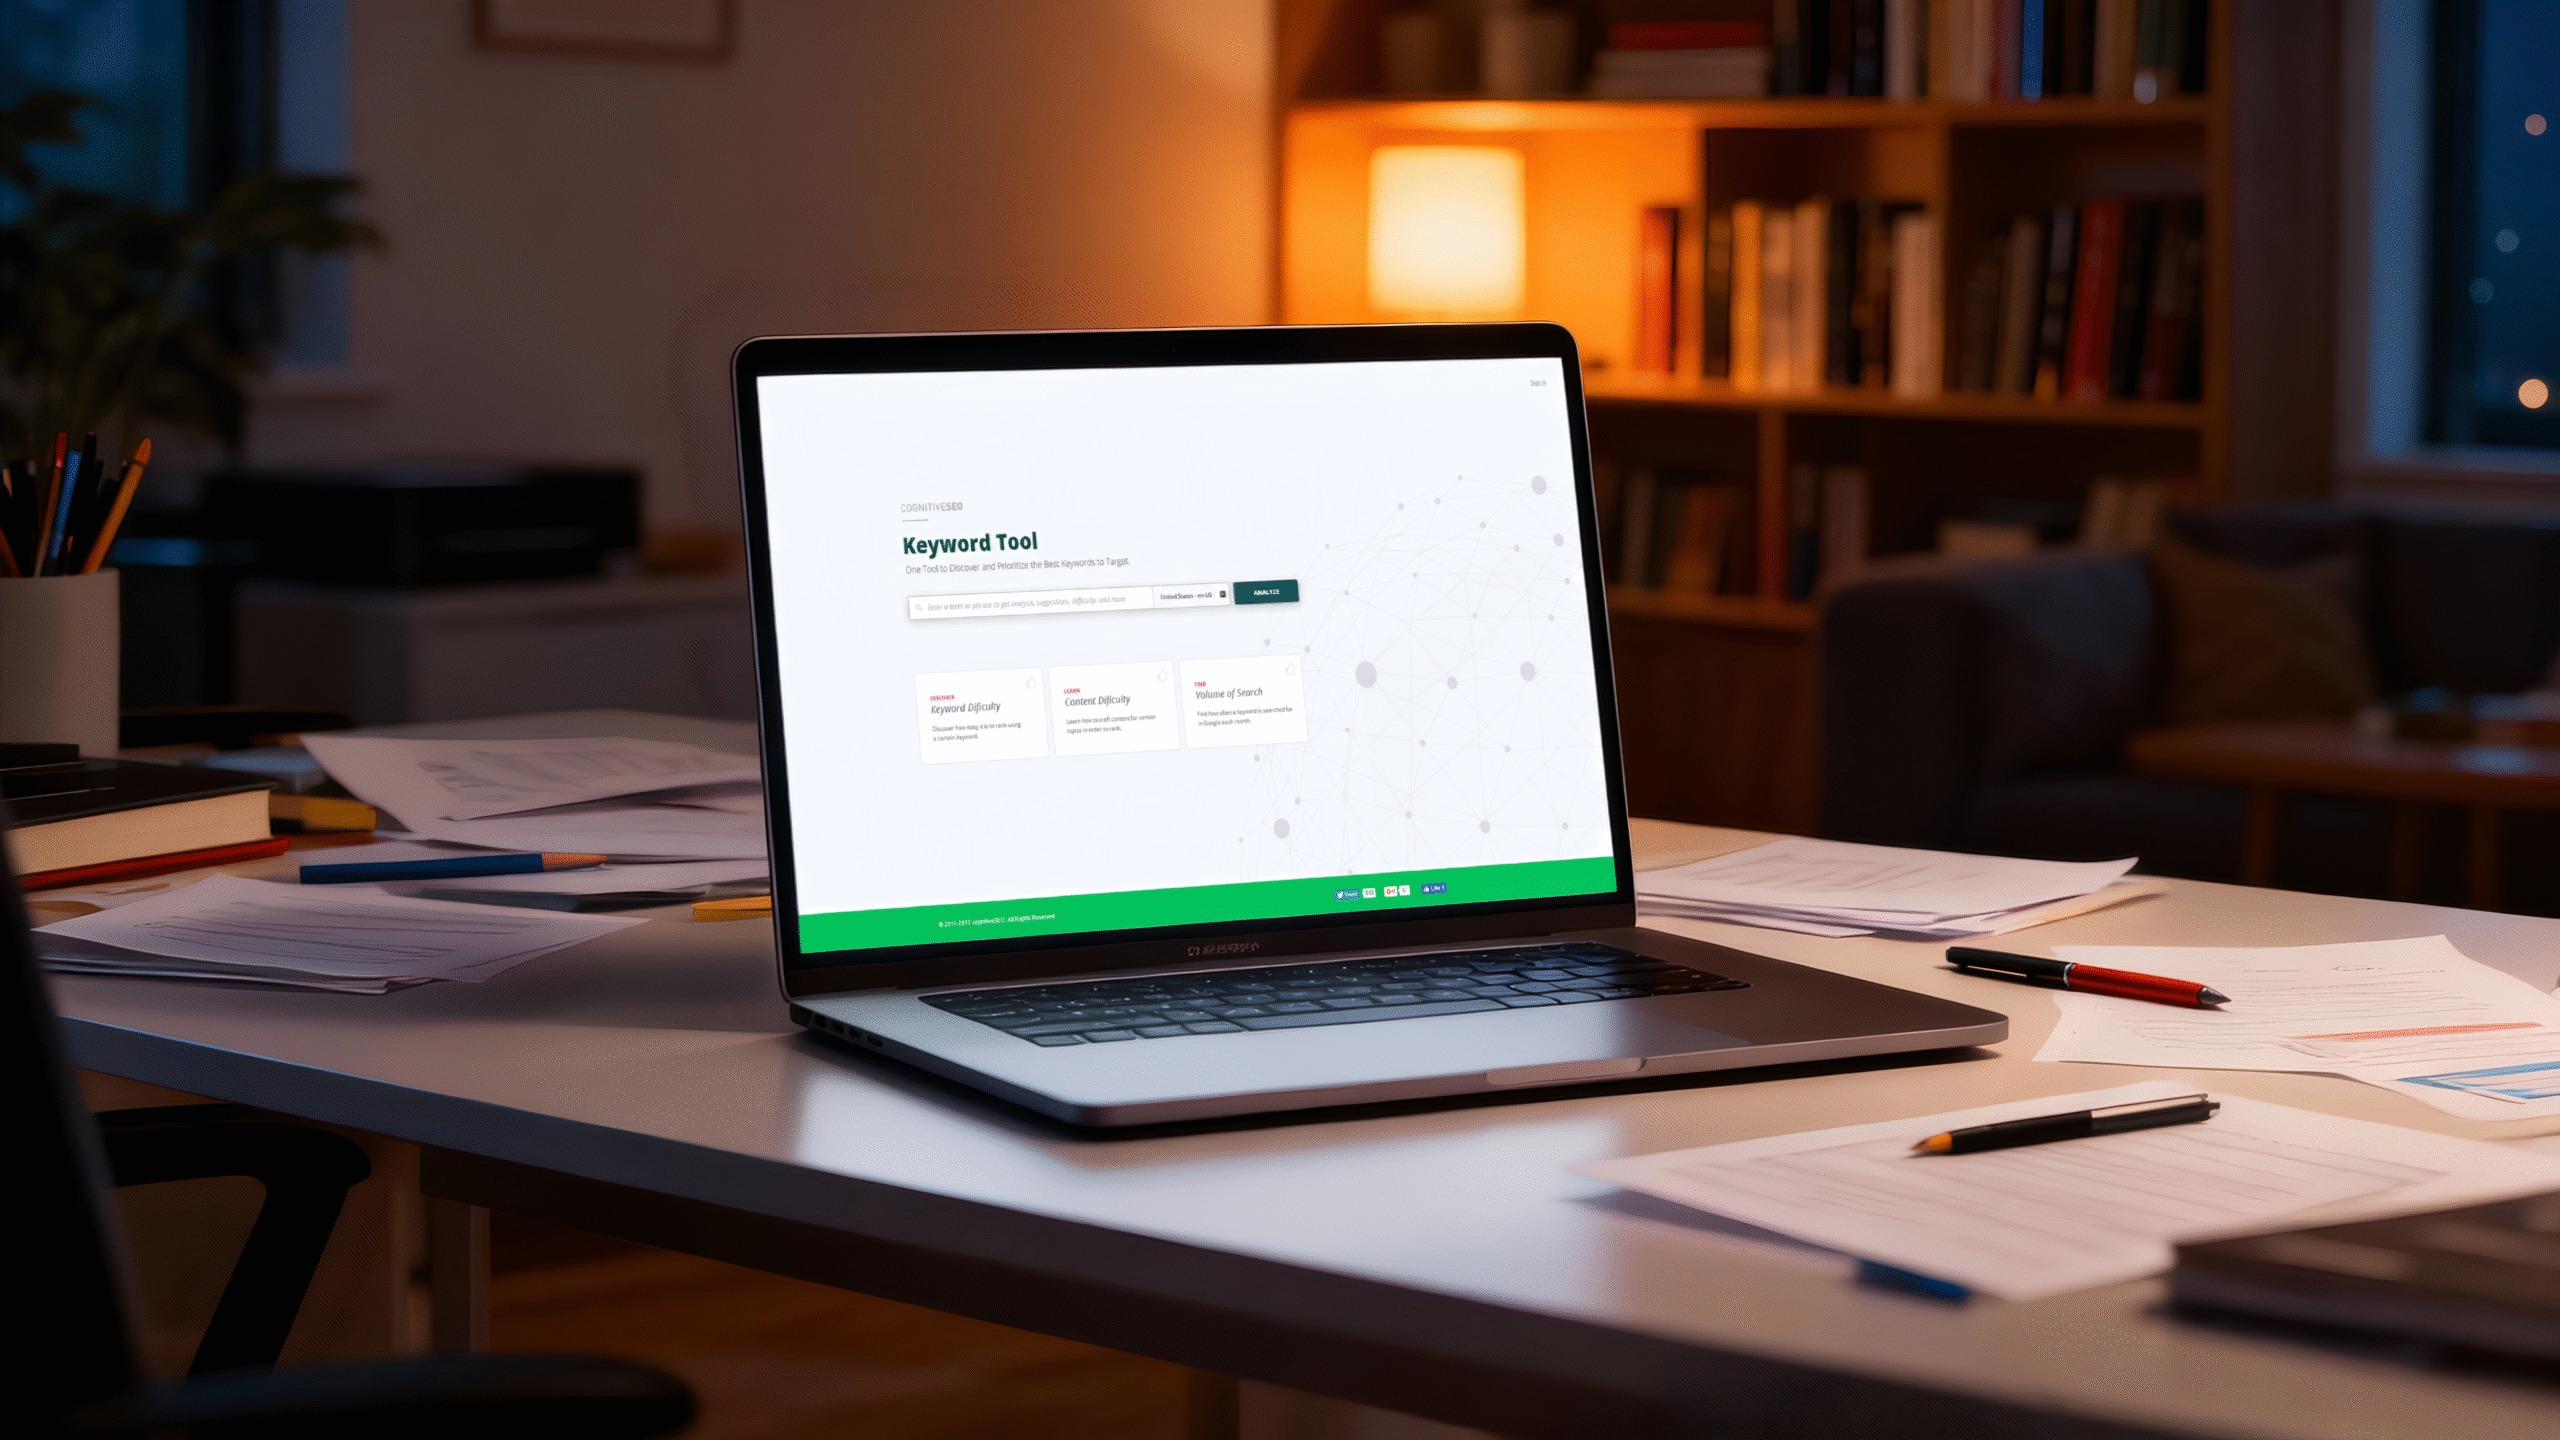
CognitiveSEO had one of the most powerful SEO analysis backends on the market. Their algorithms could tear apart keyword data, analyze competitor content strategies, and surface optimization opportunities other tools missed entirely. The engine was exceptional.
The dashboard on top of it? Not so much.
Users described it as “opening a cockpit when I just need a steering wheel.” Cluttered dashboards showing every data point the backend could generate, with no hierarchy, no prioritization, and no guidance on what to actually do with the information. Power users loved the depth but still lost time navigating it. Casual users (content marketers, small business owners, freelance writers) often churned before discovering what the platform could really do.
The problems were structural:

We restructured the platform around three core modules, each serving a distinct phase of the SEO workflow.
The Keyword Explorer was reimagined as a visual discovery tool, not a spreadsheet viewer.
Color-Coded Difficulty Scoring replaced the old numeric-only ratings. Keywords now get tagged with an intuitive color scale: green for low difficulty, amber for moderate, red for high competition. You can scan hundreds of keywords and spot opportunities instantly without reading individual numbers.
Trend Visualization swapped static snapshots for dynamic trend lines. Each keyword shows its search volume trajectory over 12 months, making seasonal patterns and emerging opportunities immediately visible. You can spot rising keywords before competitors catch on.
Dual-Axis Difficulty Display plots keywords on two dimensions: search volume on one axis, ranking difficulty on the other. This reveals the “sweet spot” keywords (high volume, low difficulty) that represent the best opportunities. What used to require mental math now takes a single glance.

The SERP Analysis module shifted from raw ranking data to content performance insights.
Instead of a list of URLs with ranking positions, the redesigned module tells the story behind the rankings. Each result is enriched with content metrics: word count, readability score, topic coverage depth, backlink strength, and content freshness. You can immediately see why a page ranks where it does and what it’d take to outrank it.
Competitor Content Cards present each ranking page as a structured card with key metrics, featured snippets, and content gaps. Compare your content against competitors side by side, with differences highlighted and actionable recommendations surfaced right there.

The Content Assistant turned writing from guesswork into guided optimization.
Real-Time Readability Feedback gives you a live readability score as you write. It updates with each paragraph, gently nudging toward clarity without being bossy. Sentence length, passive voice, and vocabulary complexity are all tracked and visualized.
Keyword Integration Feedback shows which target keywords you’ve used, which are missing, and which are overused. A visual density meter prevents keyword stuffing while encouraging natural, thorough coverage.
Topic Clustering groups related keywords and subtopics into visual clusters. At a glance, you can see which topic areas your content covers and where the gaps are. This shifted the writing process from “hit these keywords” to “cover these topics thoroughly,” a subtle but critical difference in how people approach content strategy.

We rebuilt the entire interface around modular cards. Each card represents a single insight, metric, or action. Cards can be rearranged, collapsed, expanded, and customized. Power users get the dense dashboards they want. Casual users get focused, minimal views. Same system, different configurations.
Data gets presented through hybrid visualizations that combine chart types for richer storytelling. A keyword analysis might show a bar chart of search volume overlaid with a difficulty trend line and annotated with competitive markers. These hybrid views cut down the number of screens users visit and the mental model switches they have to make.


Topic clustering uses a force-directed graph where related keywords cluster naturally. Node size reflects search volume, color reflects difficulty, and proximity reflects semantic relationship. Users can explore keyword relationships spatially, discovering connections and opportunities that tabular data simply can’t reveal.
Every module follows the same pattern: summary view shows the essentials, expanded view reveals the analysis, detail view provides the raw data. You control your depth of engagement at every point, and the interface remembers your preferences.
The redesign delivered measurable impact across the board:
The deeper impact was strategic. CognitiveSEO’s powerful backend finally had an interface that did it justice. Users who previously churned before finding the platform’s real value now discovered it in their first session. Power users who’d tolerated the complexity found themselves working faster and with more confidence.
This project reinforced something we’ve seen over and over: in data-heavy tools, the design challenge is never about showing more information. It’s about creating pathways through information that match how people actually think, decide, and act.
Ready?
We'd genuinely love to hear what you're working on. No pitch, just a conversation.
Apply for a Strategy Audit